The Polkadot (DOT) price falls under descending resistance trendline
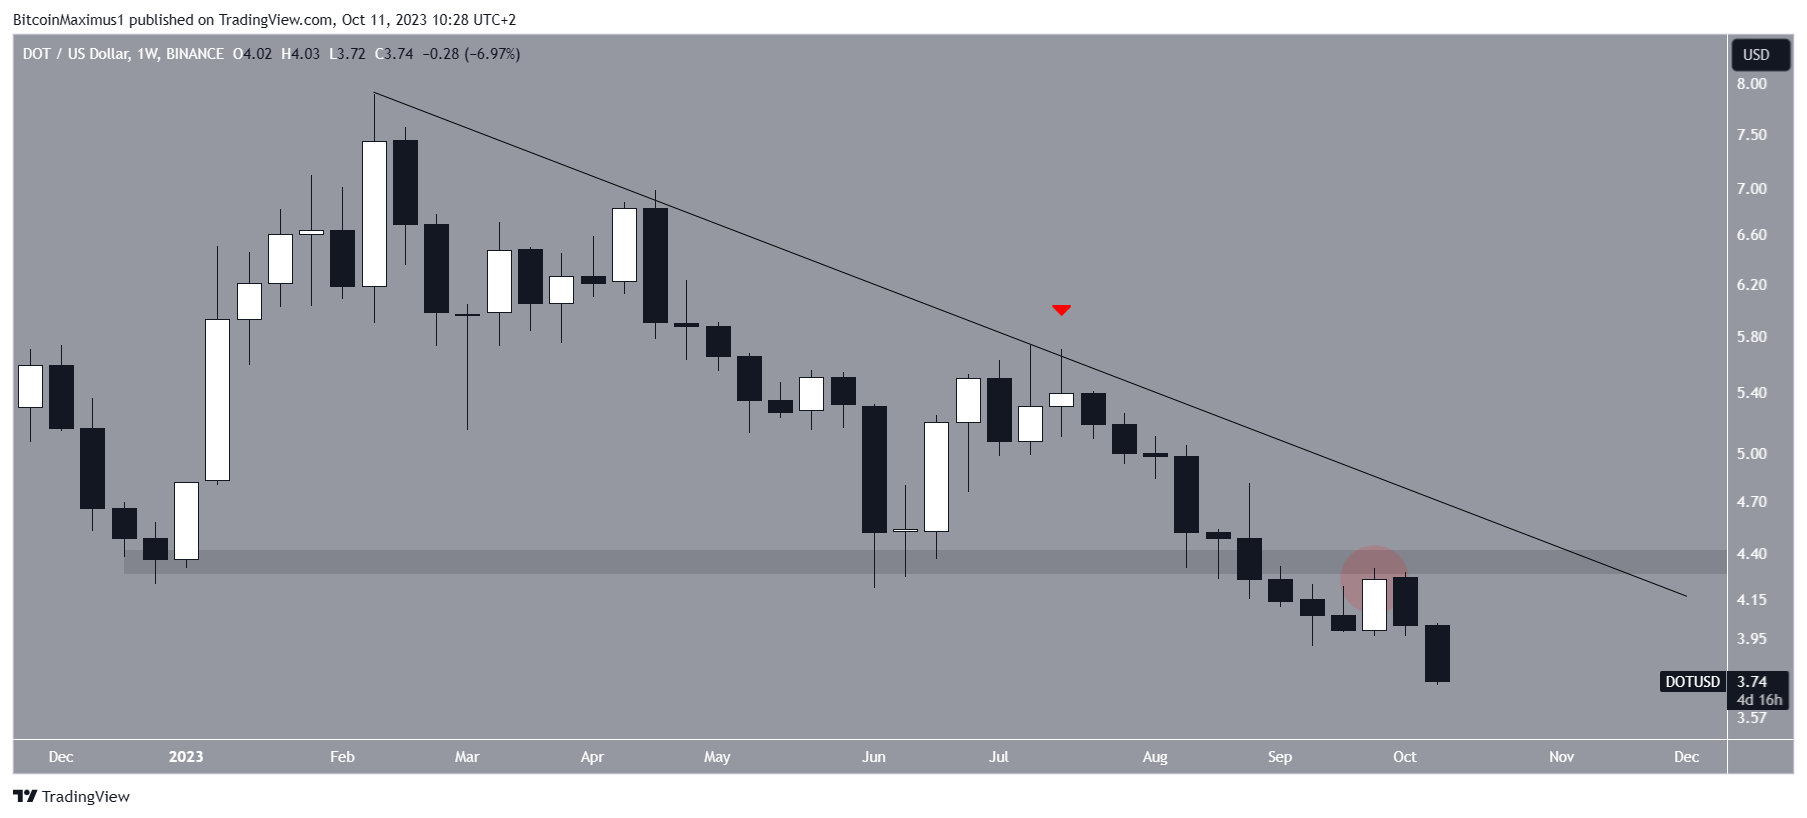
The price of Polkadot (DOT) has been experiencing a downward trend since February, as indicated by a descending resistance trendline. This decline caused a breakdown below a long-term horizontal support area at $4.30. Now the question is whether the price will bounce back or if further downside is expected.
Web3 Foundation launches new initiative
The Web3 Foundation, which is responsible for the development of Polkadot, has recently announced a new initiative. They plan to deploy a total of $22.08 million and 5 million DOT tokens over the course of four years, amounting to nearly $41 million. The aim of this program is to provide targeted financial support to projects that can have a significant impact on the future of Polkadot.
Polkadot falls below long-term support
Looking at the weekly timeframe chart, it is evident that DOT has fallen below the descending resistance trendline since February. In July, there was a rejection at this trendline, followed by a breakdown below the $4.40 horizontal support area in August. After the breakdown, this area turned into resistance in September.

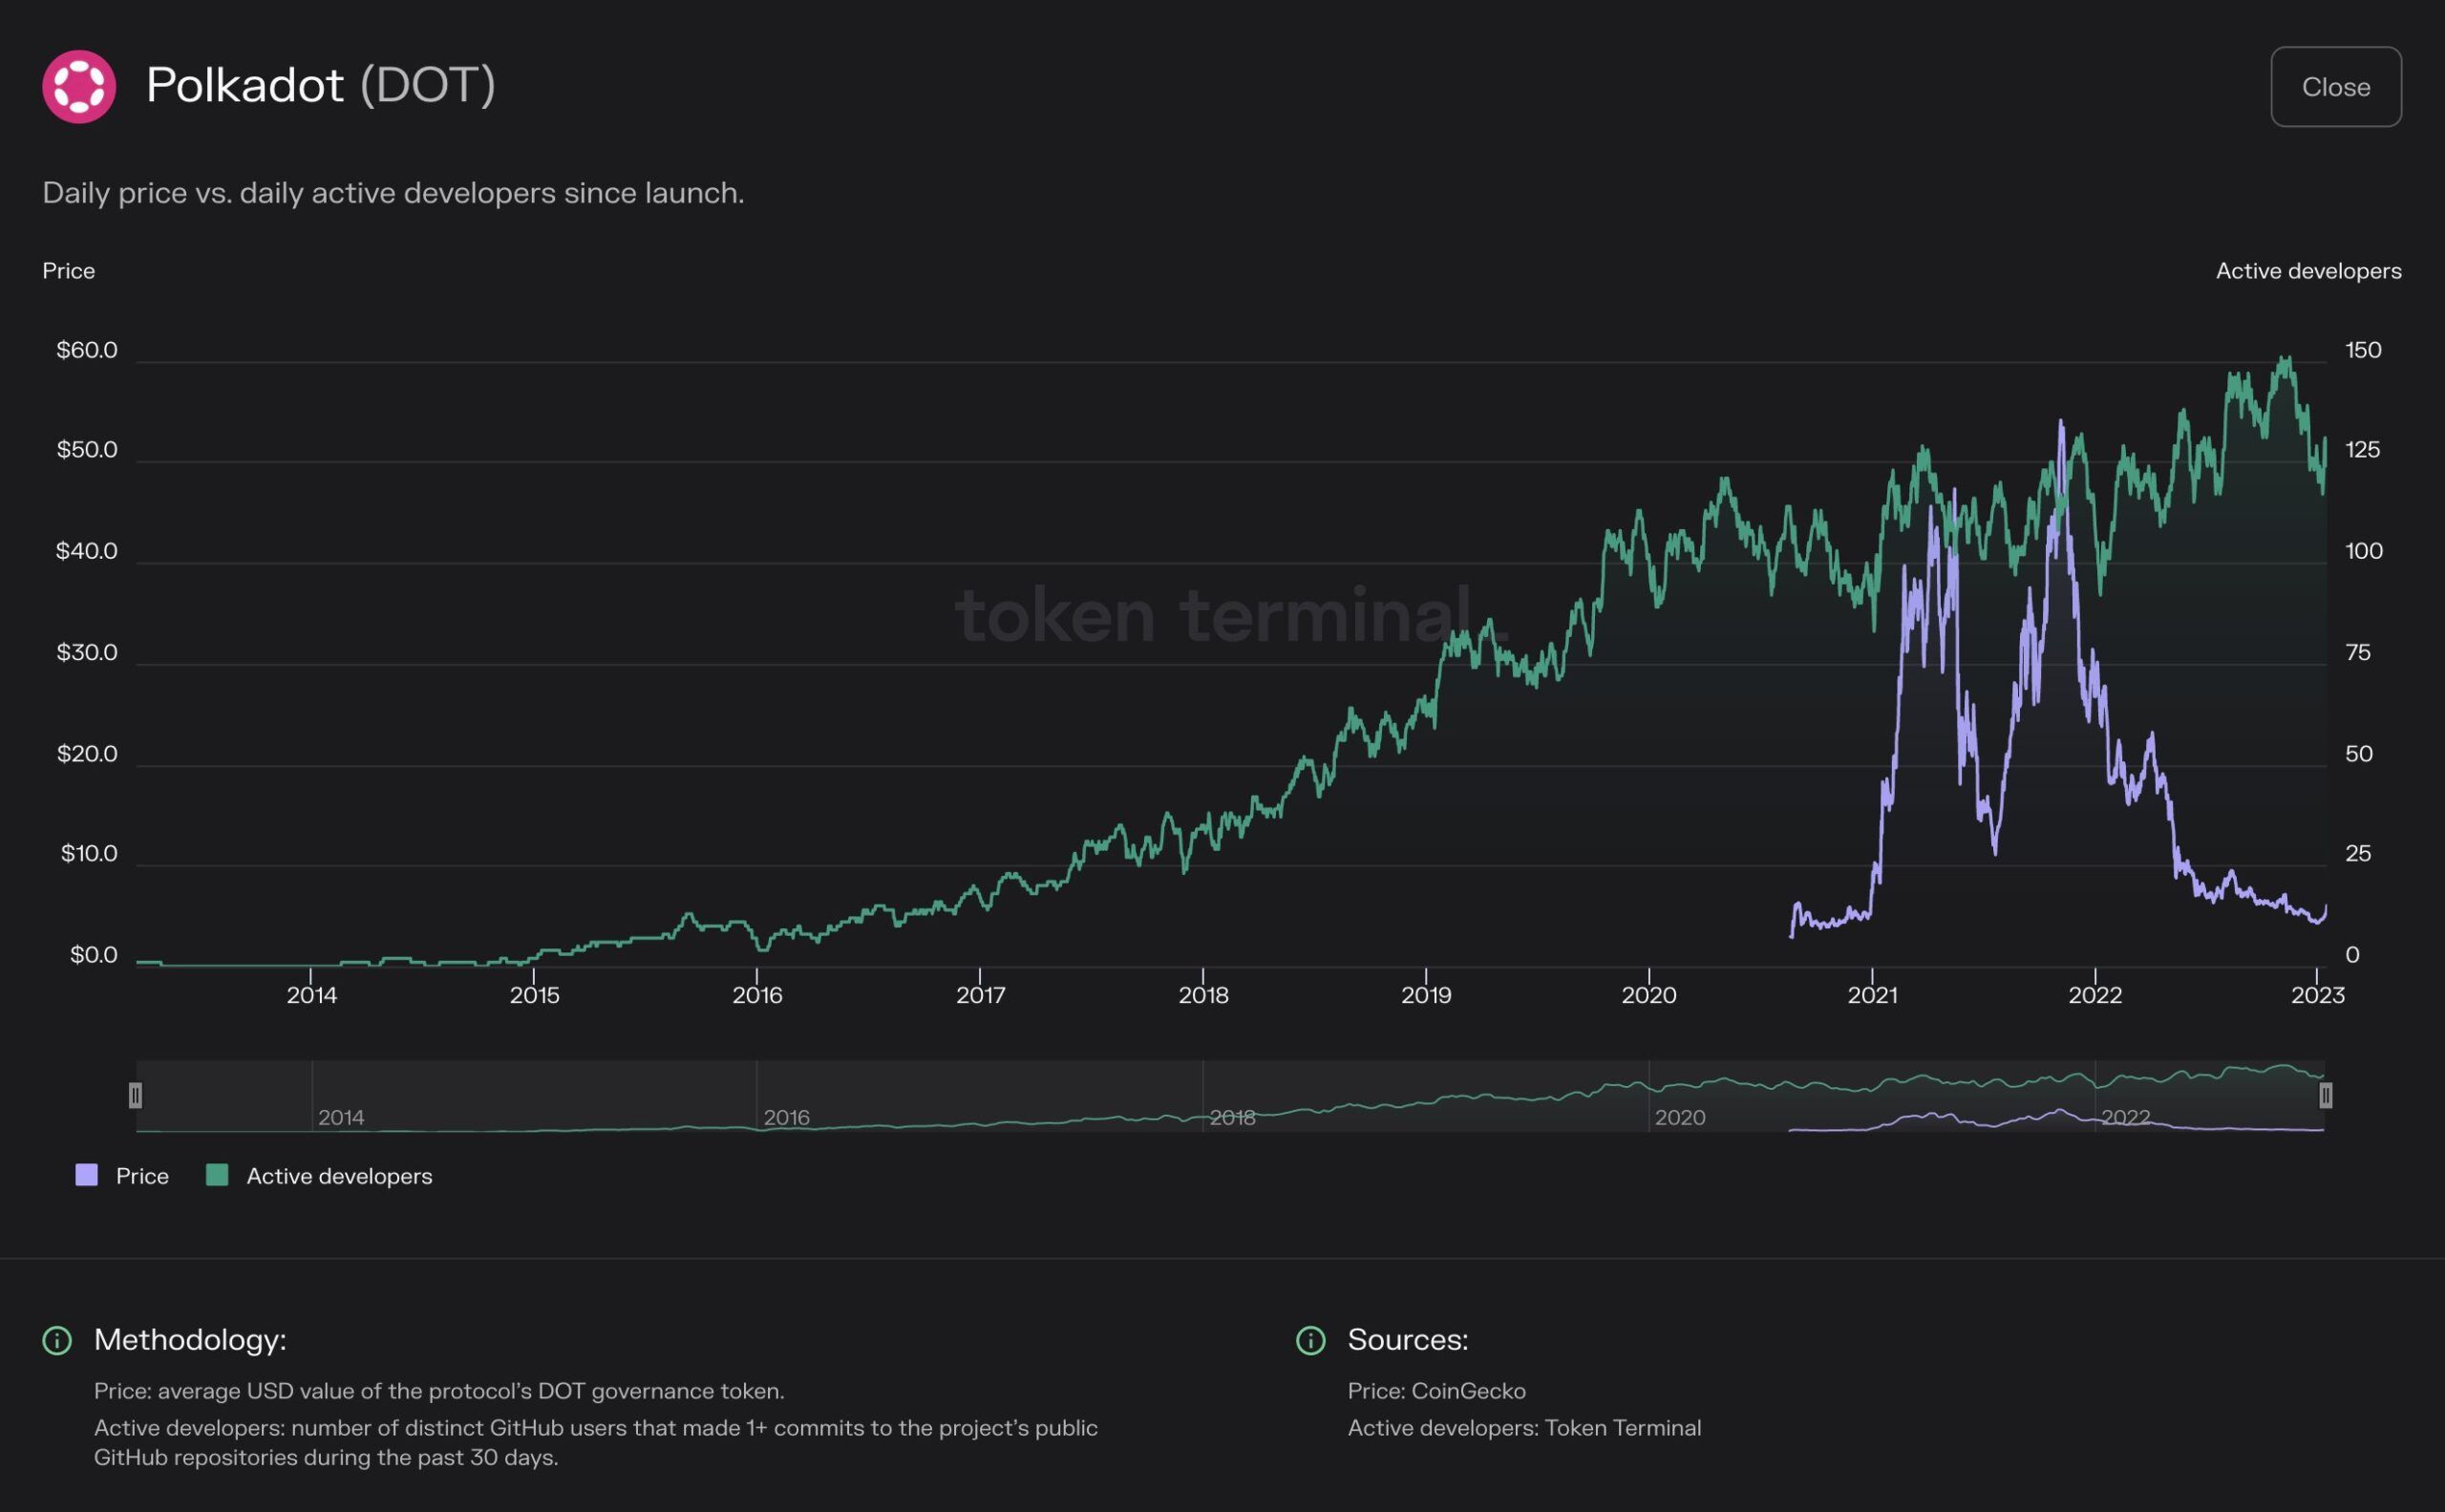
Despite the price decrease, the builders in the Polkadot ecosystem remain optimistic. The number of daily active developers is close to an all-time high, indicating a strong commitment to the project. Additionally, Polkadot has seen a significant amount of development activity and was ranked second based on GitHub commits in the past 30 days.

DOT price prediction: Where to next?
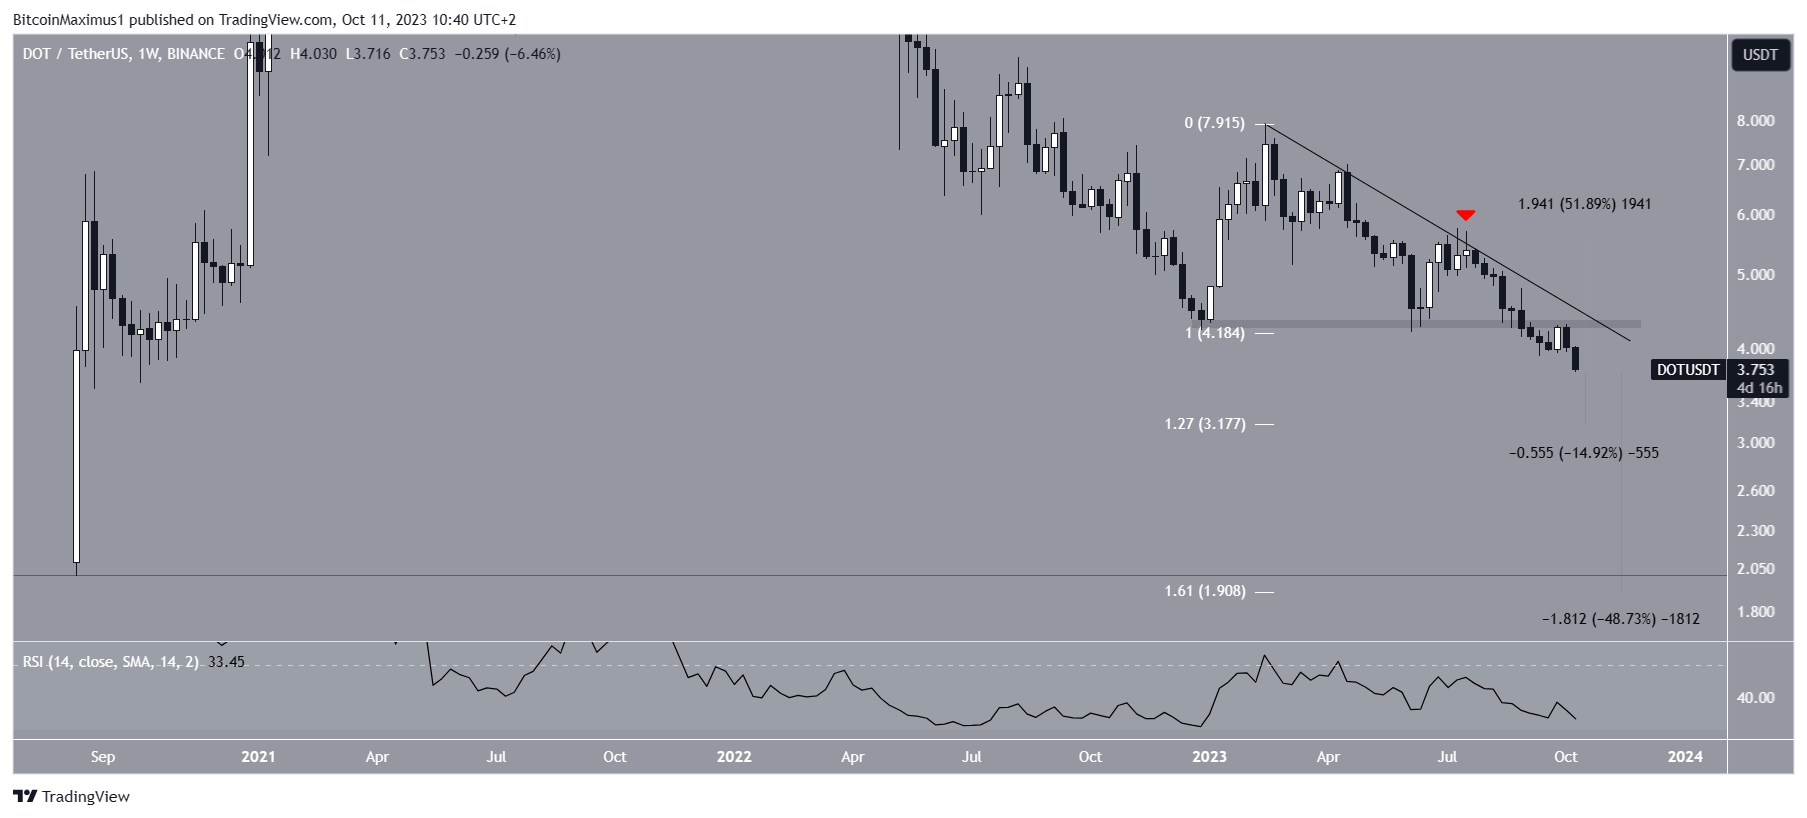
Currently, there is no significant horizontal support below the current price level. Fibonacci retracement levels can help identify potential areas for a bottom. According to this theory, after a significant price change, the price tends to partially return to a previous level before continuing in the same direction.
The weekly RSI (Relative Strength Index) also supports the continuation of the price decrease. The RSI is currently below 50 and falling, indicating a bearish trend. Fibonacci retracement levels suggest that the 1.27 Fib level at $3.20 and the 1.61 Fib level at $1.90 could serve as potential support levels.

However, if the price manages to close above the $4.30 area on a weekly basis, it would indicate a bullish trend. In that case, the price of DOT could potentially increase by 50% and reach the $5.60 resistance area.
Hot Take: Polkadot (DOT) Price Faces Bearish Pressure, but Builders Remain Optimistic
The price of Polkadot (DOT) has been falling under a descending resistance trendline since February, leading to a breakdown below a long-term support level. However, despite this bearish pressure, builders in the Polkadot ecosystem remain committed and optimistic about the project’s future. The number of daily active developers is close to an all-time high, indicating strong development activity and dedication to the project. While the price prediction suggests further downside potential, a weekly close above a key resistance level could indicate a bullish trend reversal. Overall, while the price may face short-term challenges, the underlying fundamentals and developer activity suggest long-term potential for Polkadot.


 By
By
 By
By
 By
By
 By
By
 By
By